$100M+
Revenue analyzed end-to-end
leadership revenue-protection dashboard
// data analyst · analytics engineer
I am a Data Analst and Anaytics Engineer with Bachelor's in Computer Science. History of uncovering ~$10M in revenue leakage, reducing costs by ~$1000/month, increasing marketing ROI by 20%, and signups boost by 25%. Cross-collaborated across marketing, sales, product, and growth, building tailored solutions for thier success. Managed pipelines, turned raw data into insights and presented them to leadership including CEO, COO, CTO that moved the needle and helped businesses grow!
SELECT metric, value
FROM career_impact
WHERE analyst = 'Ujjwal Jha'
ORDER BY business_value DESC;$100M+
leadership revenue-protection dashboard
~$10M
broken down by dimensions that helped solve it
96.5%
6m 40s → 14s using CTEs, indexes, joins
99.99%
7+ sources flowing into PostgreSQL
// how I add value
TECHNICAL: SQL, Python (Pandas, statsmodels, SciPy), Statistical Analysis, Hypothesis Testing, A/B Testing, ETL, ELT, Data Warehousing, AI Automation.
TOOLS: Snowflake, dbt, AWS S3, Supabase, Sigma, Power BI, Fivetran, Git, Excel, HubSpot, GitHub, Jupyter Notebooks, Claude Code.
But you don’t hire an analyst for the stack. You hire one for what happens to the business next.
fn find_the_money()
Revenue leakage, commission accuracy, payout forecasting. I dig until the numbers explain themselves, then hand leadership a decision, not a data dump.
~$10M leakage surfaced · $7M commissions at 100% accuracy
fn make_data_dependable()
Pipelines, modeling, and warehousing that nobody has to babysit. Engineered for reliability first and cost a very close second.
99.9% uptime, Fivetran spend ~$1000/M → $0
fn ship_decisions()
Executive views the C-suite actually opens every morning. Designed around the questions leadership is really asking.
$33M+ tracked for COO/CTO · 3 dashboards in the first 4 days of joining
// where I’ve done it
US-Based Fitness Company
Nov 2025 – Jan 2026
Early Stage Startups
Mar 2021 – Present
// the toolkit
TABLE skills.analytics_experimentation
TABLE skills.data_engineering
TABLE skills.warehouses_databases
TABLE skills.bi_visualization
// selected work
Each one built end-to-end: raw data → pipeline → model → a dashboard someone can act on.
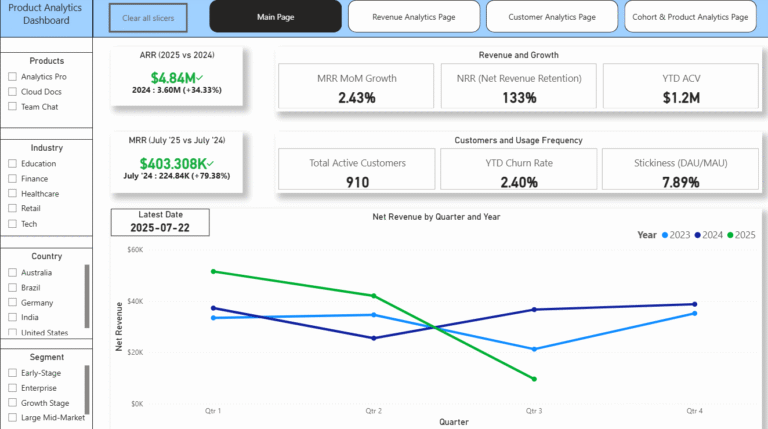
End-to-end product analytics delivering executive-ready insight across revenue, customer behavior, cohorts, and product performance.
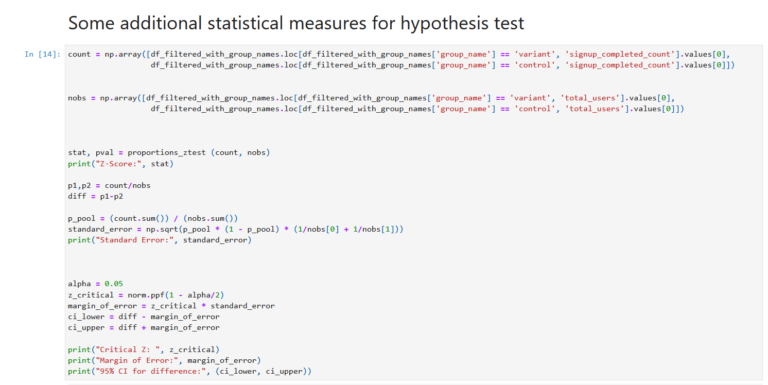
Designed the experiment schema, applied statistical hypothesis testing to a simplified sign-up flow, and shipped a decision-ready results dashboard.
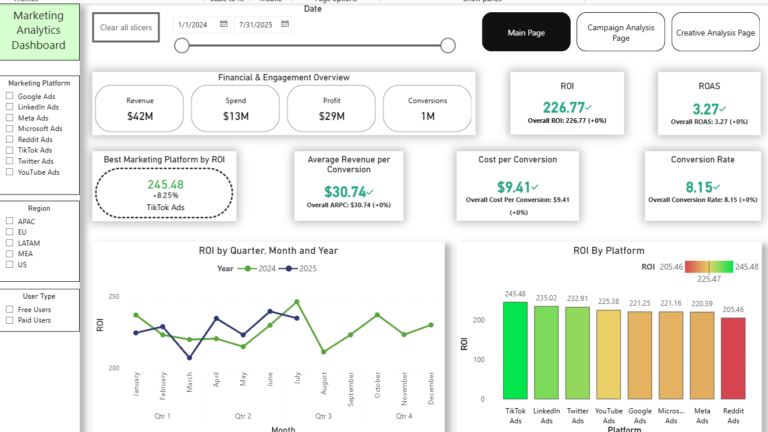
ETL, data modeling, and dashboards for campaign & creative performance — surfacing top channels, campaigns, and CTAs.