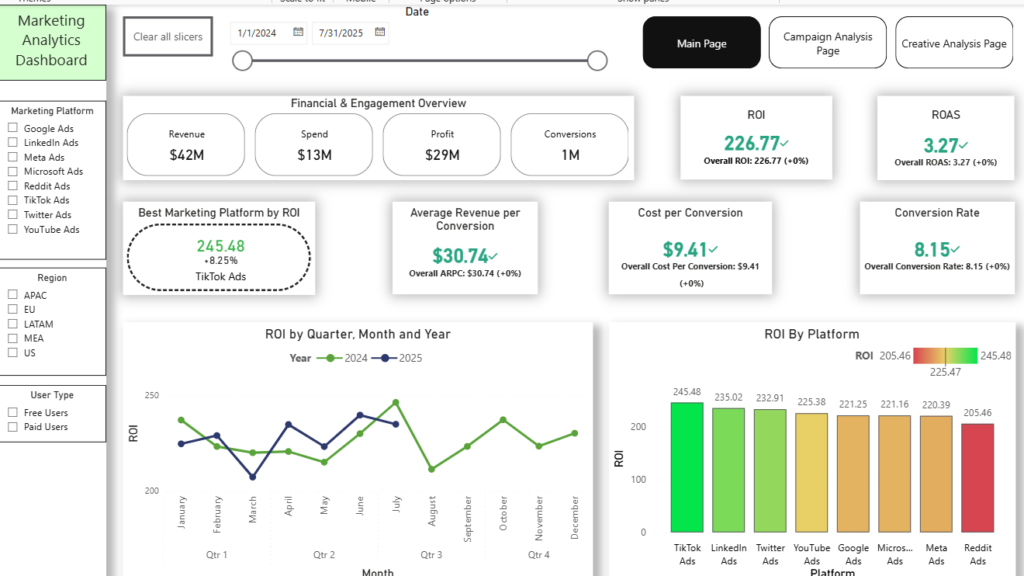
Built an end-to-end marketing analytics solution from a normalized data warehouse to a 3-tier Power BI dashboard, giving leadership platform, campaign, and creative-level visibility into $42M in ad revenue across 8 platforms and 5 regions.
Tools: SQL (PostgreSQL), Power BI (DAX), LLM-assisted data generation
Dashboard Link: Live Dashboard Here
GitHub Link: Check SQL Queries, and more from here
View Data Schema: Data Schema
Note: After clicking on Live Dashboard, please select the “Fit to Page” or “Full Screen Mode” option on the live screen.
The Problem: A company running paid campaigns across 8 platforms (Google, Meta, TikTok, LinkedIn, Reddit, and others) had no unified way to compare performance — spend, ROI, and creative effectiveness all lived in disconnected silos, making it impossible to answer questions like “which platform, campaign, or ad creative is actually working” without manually pulling numbers from each channel.
What I Did:
- Modeled the source data as a normalized snowflake schema (channels → campaigns → ad groups → ads → daily metrics, plus a many-to-many ad-to-audience bridge table), then built 10+ materialized views that flatten it into a denormalized star-schema mart, pre-joining platform, campaign, and objective directly onto fact rows so Power BI queries stay fast without multi-hop joins.
- Modeled a conversion funnel view (impressions → clicks → conversions) to track drop-off at each stage of the customer journey, alongside ranking queries (DENSE_RANK) surfacing the best-ROI platform per channel type, best-ROI campaign per platform, and best-CTR creative type and call-to-action combination, plus year-over-year ROI comparisons by month and quarter.
- Built a 3-page Power BI suite (Main Executive Overview, Campaign-Level Analysis, Creative-Level Analysis) using DAX measures for core KPIs (ROI, ROAS, ARPC, CTR, CPC, CPM) and a metric-toggle feature to switch chart dimensions on demand, with cross-filtering by platform, campaign, region, creative type, objective, and targeting type.
What It Found:
- TikTok Ads posted the highest ROI at 245.48 (+8.25% vs. the overall average), while Reddit Ads lagged at 205.46. A clear signal of where budget is working hardest.
- Campaign_021 outperformed every other campaign at a 296.30 ROI (+30.66% vs. overall), standing out as the single best-performing campaign in the portfolio.
- Image creatives had the highest CTR (2.76%) of any creative type, and “Sign Up” was the best-performing call-to-action (2.80% CTR) — concrete, testable guidance for future ad copy.
- No single ad copy variant (A-D) consistently won across all four quarters — CTR leadership rotated between variants quarter to quarter, showing creative performance isn’t static and needs ongoing testing rather than a “set once” approach.
Impact
Replaced fragmented, platform-by-platform reporting with a single 3-tier dashboard: Main, Campaign, and Creative, giving stakeholders at every level (from “how’s marketing doing overall” to “which specific ad copy is winning”) a self-serve answer, backed by a warehouse architecture designed for both data integrity and dashboard performance.