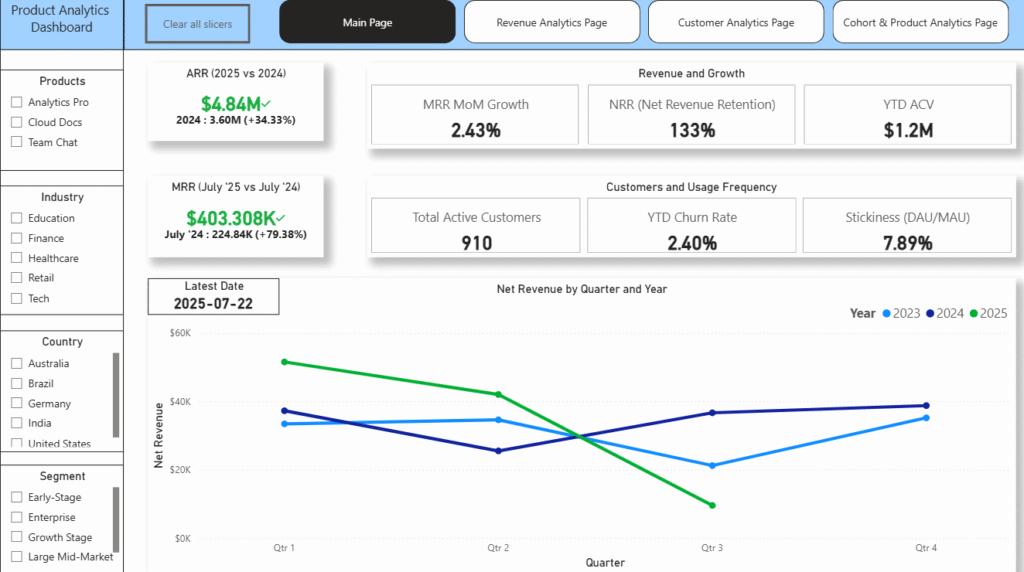
Developed a full-stack analytics solution, from data model to live dashboard, for a 3-product B2B SaaS company (1000+ accounts, 50M+ usage events), making it a single source of truth for revenue, retention, and product engagement.
Tools: SQL, Power BI, LLM-assisted data generation
Dashboard Link: Live Dashboard Here
GitHub Link: Check SQL Queries, and more from here
View Data Schema: Data Schema
Note: After clicking on Live Dashboard, please select the “Fit to Page” or “Full Screen Mode” option.
The Problem: A growing SaaS company selling 3 products was struggling to see the business as a whole, including subscription data, usage events, and revenue. All sat disconnected and inaccurate. Leadership couldn’t answer basic questions like “Which segment is actually profitable?” or “Where are we bleeding customers?”
What I did:
- Designed a Kimball-style star schema from scratch, having 7 dimension tables and 3 fact tables, modelling accounts, subscriptions, transactions, and product usage events across three products, with fact tables holding direct foreign keys to every dimension they report against for fast, join-light queries.
- Wrote 30+ production-style SQL views and CTEs to calculate the metrics that actually matter to a SaaS business: MRR/ARR, NRR/GRR, churn, cohort retention, DAU/MAU stickiness, seat utilisation, and feature adoption, including the messy edge cases (rolling 12-month windows, multi-subscription churn logic, YTD comparisons).
- Turned it into a 4-page Power BI suite (Executive, Revenue, Customer, Cohort & Product) with cross-filtering by product, segment, industry, and country.
What it found:
- Analytics Pro drives 58% of revenue, and MRR grew 79% YoY. A clear signal on where to double down.
- Retail alone accounted for $50K of $102K in total churned revenue, which is the retention team’s real priority, hiding in plain sight.
- Enterprise is only 51% of the customer base but generates the outsized share of revenue. The sales were likely under-indexed here.
- 960 of 1,064 subscriptions had auto-renew on, but seat utilisation sat at 88.6%, meaning some of that “safe” revenue was actually at upsell or leakage risk.
- Web usage (57%) dwarfed mobile (iOS 32%, Android 28%) despite 45% overall feature adoption. A concrete gap for product to close
Impact:
Gave leadership a live, filterable view of $4.8M ARR, 133% NRR, and 2.4% churn, replacing what would otherwise be scattered spreadsheets with one dashboard non-technical stakeholders can self-serve from.