Designed, ran, and statistically validated an A/B test on a startup’s signup page, from data model to hypothesis testing to a stakeholder-facing dashboard, determining with 95% confidence that a simplified signup flow lifted signup rate by 10-19%.
Tools: SQL (PostgreSQL), Python (pandas, NumPy, SciPy, statsmodels, Plotly, SQLAlchemy), Power BI, LLM-assisted data generation
Dashboard Link: Live Dashboard Here
Python (A/B and Hypothesis Test): Python Notebook
View Data Schema: Data Schema
GitHub Link: Check SQL Queries, and more.
Note: After clicking on Live Dashboard, please select the “Fit to Page” or “Full Screen Mode” option on the live screen.
The Problem: A startup’s signup rate was too low to hit growth targets, but nobody had isolated why. Was it the funnel, the page design, or something else? Leadership needed a real experiment, not a guess, before committing engineering time to a redesign.
What I Did:
- Traced the signup funnel and found the largest drop-off occurred at the user info page — the specific point users abandoned before completing signup.
- Designed the A/B test end-to-end: control/variant split, sample size, exposure definition (deliberately excluding “page render” events and counting only confirmed
element_visibleexposure to avoid biasing results toward users who never actually saw the test), and primary/secondary success metrics. - Built a 6-table relational schema (experiments, groups, assignments, exposures, events, users) to track the test cleanly from assignment through conversion.
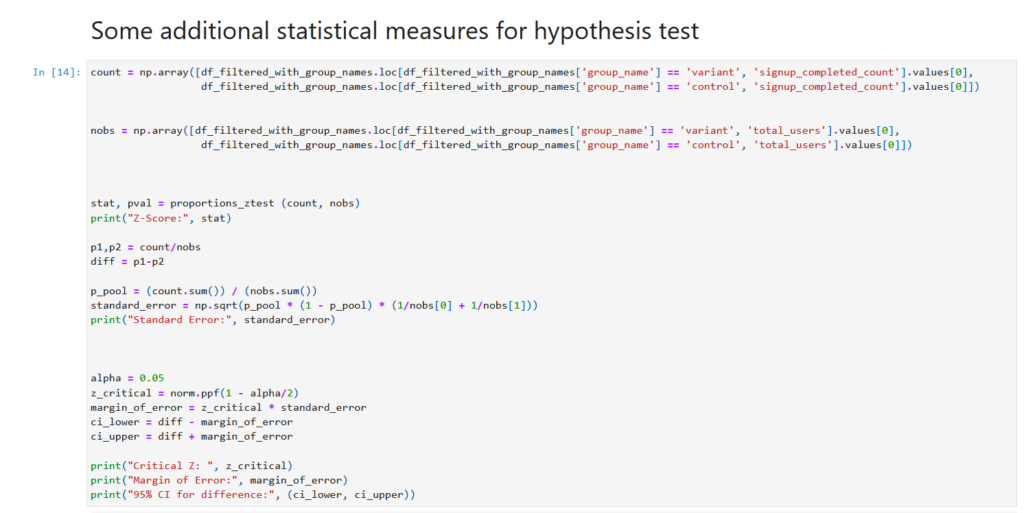
- Connected to PostgreSQL from Python via SQLAlchemy/psycopg2, then ran a two-proportion z-test (statsmodels) to compare signup rates between groups, visualizing intermediate results in Plotly before stress-testing with stratified robustness checks across 5 countries and 3 device types.
- Shipped a self-serve Power BI dashboard so non-technical stakeholders could slice results by group, country, and device without needing to re-run the analysis.
What It Found:
- Primary signup rate: 33.3% (control) vs. 47.6% (variant). A 14.3 percentage point lift, statistically significant at p < 0.0001 (z = 6.52).
- 95% confidence interval for the lift: 9.99% to 18.60%. The basis for the “at least 10% improvement” claim to stakeholders.
- Secondary signup completion rate (of those who started) also favored variant: 69.19% vs. 61.90%.
- Every single subgroup cut, 5 countries, 3 device types: independently confirmed the effect in the same direction, ruling out the result being an artifact of one region or platform (a Simpson’s-paradox check).
Impact:
Gave the team statistically defensible grounds to ship the simplified signup page, backed by a documented test design, a robustness-checked result, and a live dashboard stakeholders could trust and explore themselves, rather than a one-off analysis buried in a notebook.