-
Sales Dashboard
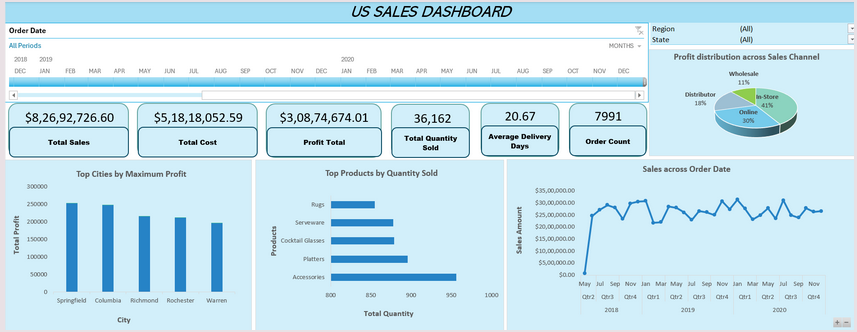
Tool: Excel Link: GitHub Sales Dashboard Situation Many start-ups and companies in general find it difficult to manage their sales and relevant KPIs that can track their performance in various regions, states, and more. They are also not able to understand the regions, products, or services that they need to push more or improve because…
-
Product Analytics
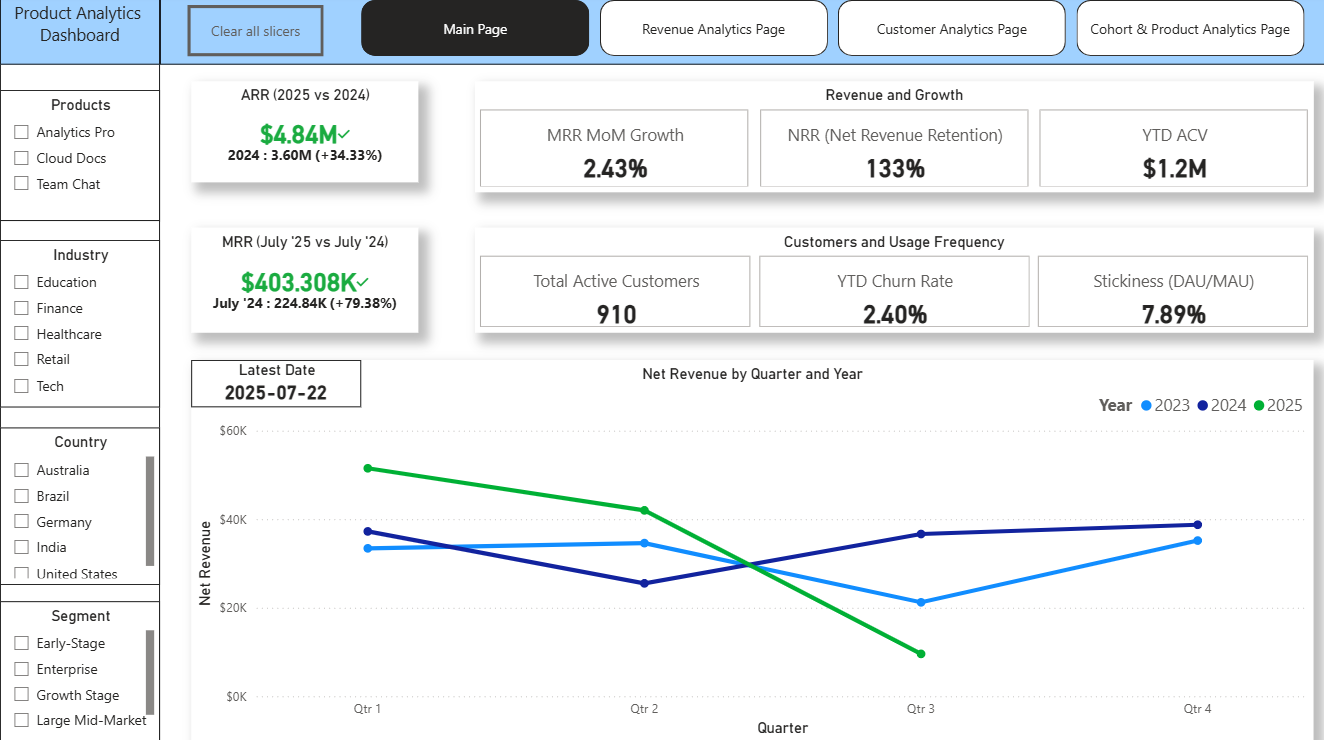
Tools: SQL, Power BI Dashboard Link: Live Dashboard Here GitHub Link: Check SQL Queries, and more from here View Data Schema: Data Schema Note: After clicking on Live Dashboard, please select the “Fit to Page” or “Full Screen Mode” option on the live screen so that the dashboard can adjust according to your desktop or…
-
Sign-up Rate Improvement (A/B Test, Hypothesis Test)
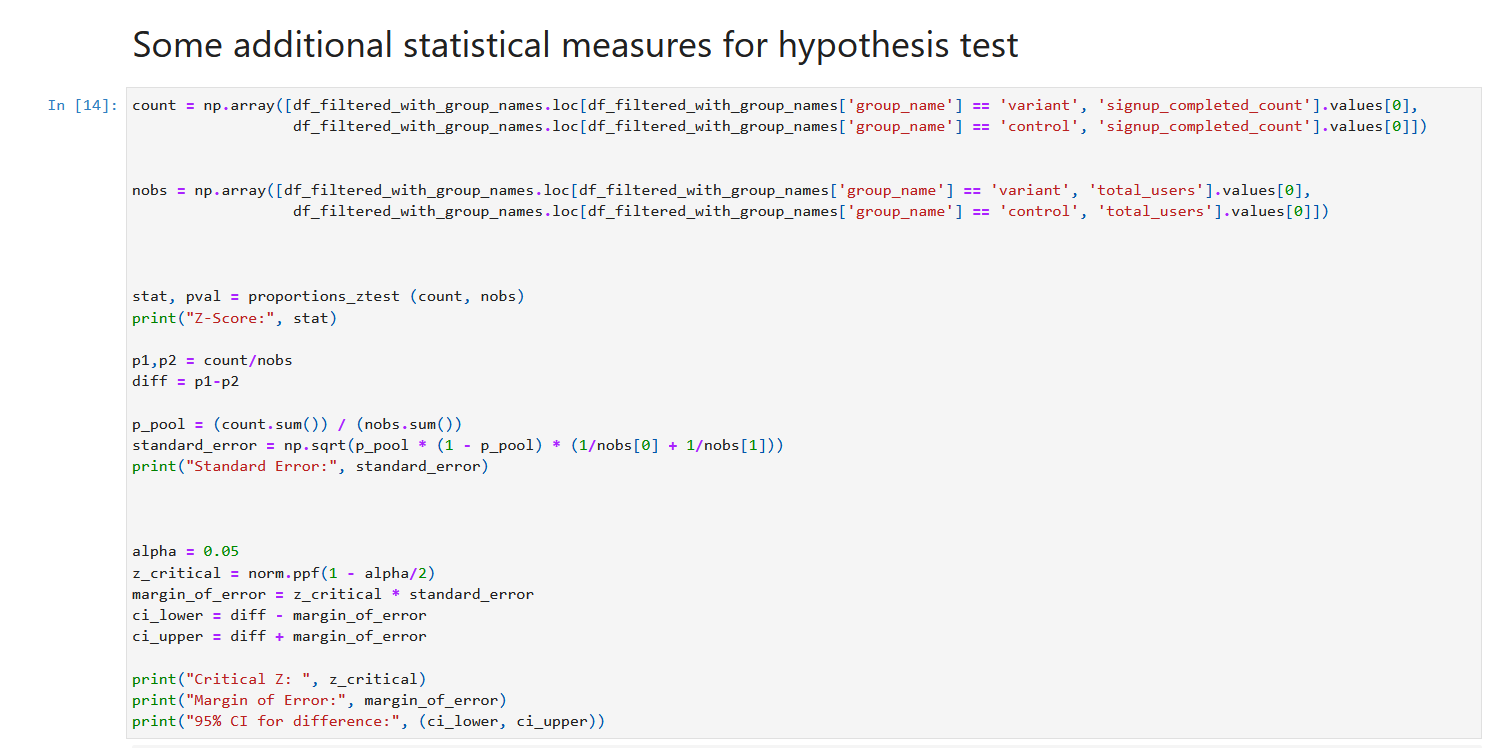
Tools: SQL, Python, Power BI Dashboard Link: Live Dashboard Here Python (A/B and Hypothesis Test): Python Notebook View Data Schema: Data Schema GitHub Link: Check SQL Queries, and more. Note: After clicking on Live Dashboard, please select the “Fit to Page” or “Full Screen Mode” option on the live screen so that the dashboard can…
-
Marketing Analytics
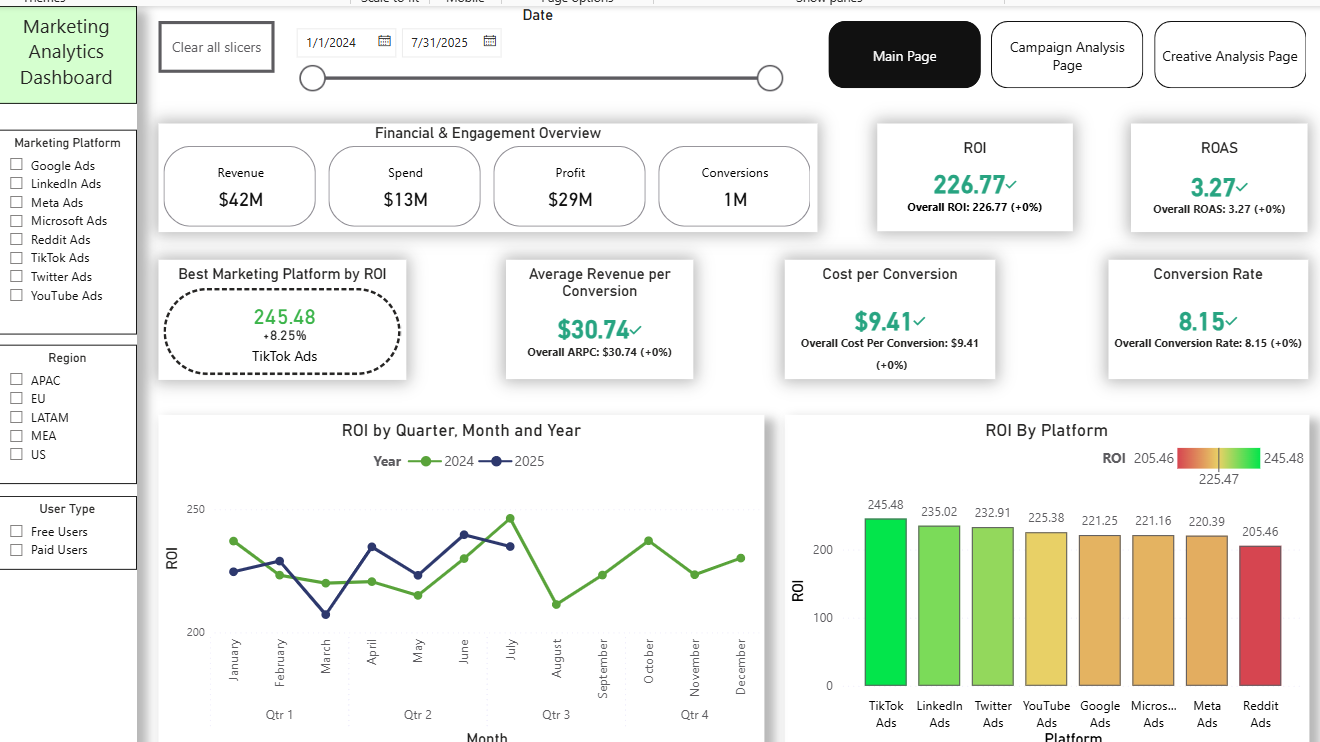
Built a three-tier interactive dashboard (Executive, Campaign, Creative) analyzing $42M revenue, 614M impressions, and 1M conversions across 8+ platforms. Automated KPI tracking (ROI, ROAS, CTR, CPC, CPM, ARPC) and reduced reporting time by ~60%. Enabled instant deep dives with slicers, identified top/underperformers, and guided budget reallocations that improved ROI by ~15%.
<- Reach out!

Category: Projects
No comments to show.